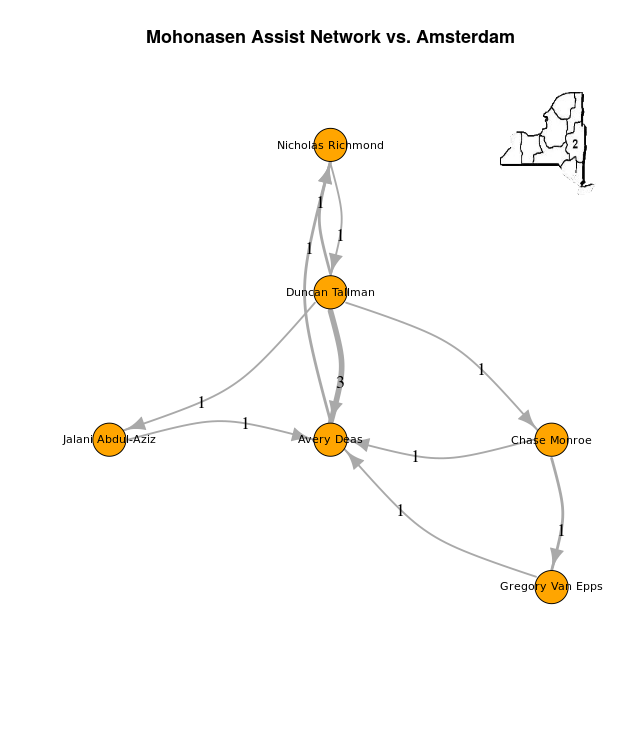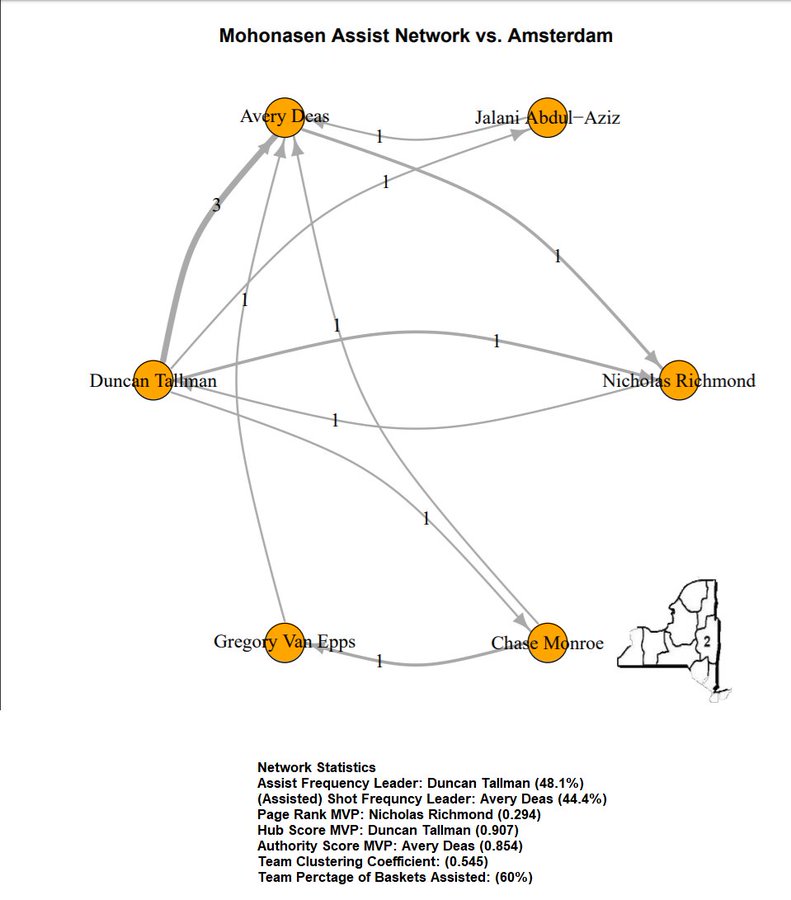
Section2Basketball.com, in partnership with Luke Benz of Yale Sports Analytics, is now able to offer custom team & player analysis based on all assisted and unassisted made baskets during a game. It’s called the Assist Network (pictured above & below are the outputs based on each team’s data).
Here’s the link to run the reports.
Information on what the assist networks represent, what data is necessary to create them and how it’s done.
- The Assist Networks show which players during the game had assists and who they setup with those passes. Those assists are represented by arrows OUT of the player’s circle. In turn it shows players that have scored baskets and who set them up with assists with arrows IN to their player circle. They can also show viewers how many people were involved in the offense and the percentage of assists to made baskets. The more assists per team field goals shows a team that shares the basketball more. If the team assists per made field goals is less than 50% that usually shows a team’s offense that is based more on isolation plays.
- The basic stats that you’ll need to create these graphs. 1. Team name of basket scored. 2. Name of player who scored the basket. 3. Player who assisted that basket, or leave blank if no assist. 4. Was the basket a 2 point FG or a 3 point FG?
- Below is an example of how an excel upload sheet is setup so users can upload their team’s data to run a network.
| Team Name | Player scoring | Player assisting | points |
| Mohonasen | Nicholas Richmond | Avery Deas | 3 |
| Amsterdam | Willie Brown | 2 | |
| Amsterdam | Lou Fedullo | Willie Brown | 2 |
| Mohonasen | Jalani Abdul-Aziz | 2 | |
| Amsterdam | Willie Brown | 2 | |
| Amsterdam | Lou Fedullo | Willie Brown | 2 |
| Amsterdam | Lou Fedullo | Willie Brown | 2 |
| Amsterdam | Jeff Brennan | Osvauldo DeJesus | 3 |
| Amsterdam | Deanthony Colon | Willie Brown | 3 |
| Amsterdam | Willie Brown | 3 | |
| Mohonasen | Avery Deas | Duncan Tallman | 2 |
| Mohonasen | Avery Deas | Duncan Tallman | 2 |
| Mohonasen | Avery Deas | Chase Monroe | 2 |
You’ll see that the upload sheet is very simple. Just takes basic information that is usually tracked by all teams.
**What if you don’t want to keep track of the opponent’s scoring & assists? Well, here’s how to add just 1 line on the upload sheet so your opponent name appears in your report but you don’t have to worry about their stats. In this example I’m using Amsterdam as the team I want to run the report for and Mohonasen, their opponent, with blank stats. The first line on the excel sheet, under the player headings will show the opponent for the game and then the full stats for the team you want a run the assist network. (You need at least 1 line with the other team’s name as the system requires you to pick a team for the report and their opponent)
| Team Name | Player scoring | Player assisting | points |
| Mohonasen | NONE | 2 | |
| Amsterdam | Deanthony Colon | Willie Brown | 3 |
| Amsterdam | Deanthony Colon | Tristan Green | 3 |
| Amsterdam | Jeff Brennan | Osvauldo DeJesus | 3 |
| Amsterdam | Jeff Brennan | Deanthony Colon | 3 |
| Amsterdam | Jeff Brennan | 2 | |
| Amsterdam | Lou Fedullo | Willie Brown | 2 |
| Amsterdam | Lou Fedullo | Willie Brown | 2 |
| Amsterdam | Lou Fedullo | Willie Brown | 2 |
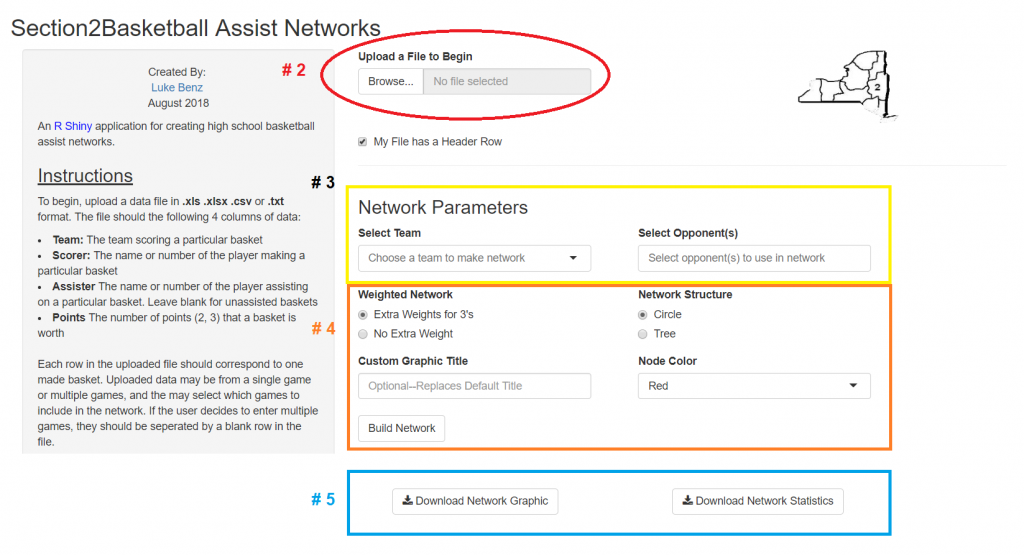
Here’s how to upload the team sheet to the network. There’s an itemized step by step display below as well.
1. Go to https://lbenz730.shinyapps.io/section_2_basketball_networks/
2. Click browse where it says upload file to begin. That will take you to your files and then find your assist network file and upload it. (If you have a header row like the above sample sheet leave the box checked that says : My file has a header row.
3. Under Network Parameters select the team that you’d like to run the report for then pick the opponent.
4. The final options before seeing the network display. First you have to choose having 3 pointers weighted more than 2 point FG assists or making them all the same weight. (Personally, I prefer the weighted 3 pointers as they are more points than a regular 2). Next choice is a circle or tree display. After that you have the option to add custom text that will show up on the top of the report. Last step before generating final result is picking the color you’d like the player’s circles to be. When that is complete click the Build Network button.
5. After the report is run the user has the option to Download Network Graphic and Download Network Statistics.

- Assist Frequency Leader: Willie Brown (37.5%)
- (Assisted) Shot Frequncy Leader: Lou Fedullo (50%)
- Page Rank MVP: Lou Fedullo (0.364)
- Hub Score MVP: Willie Brown (0.801)
- Authority Score MVP: Lou Fedullo (0.911)
- Team Clustering Coefficient: (0.273)
- Team Percentage of Baskets Assisted: (50%)
Sample of a Tree Network

For any comments or questions on the assist network feel free to reach out on twitter at https://twitter.com/section2hoop or email Ed at This email address is being protected from spambots. You need JavaScript enabled to view it..


