Every night during the Section 2 basketball season I track down as many scores as I can find through social media and from coaches & athletic directors that send end of game reports to the site’s email address (This email address is being protected from spambots. You need JavaScript enabled to view it.). I’ve managed to do a decent job on most nights, just finding scores, but I’ve noticed I haven’t given enough attention to the schools that take the time to report their game stats with quarter scores.
So I’ve spent the last few months creating and testing a program that analyzes each stat report and generates a game recap with a few graphics. The program is designed to take as much information as possible from those email reports and to create a rough draft article that can be edited and adjusted for any additional content sent to us about the game.
All recaps that are entered into the system, so far, are HERE:
By having the program analyze each stat report it will help enormously with the greatest obstacle from the site producing more game recaps on a nightly basis, TIME!!! It will enable me to quickly read the article, edit it, and add any other relevant details that were passed along through social media or email. My hope is that these articles will give teams and players added exposure on a nightly basis. It will give some context behind the numbers.
All that being said, none of this works unless coaches and administrators take the time to email us the end game reports. Those reports are the same stats that have been sent to traditional media outlets for as long as I can remember. If you haven’t already added the site to your media contacts please do, thanks.
Below you’ll see a sample excel version of what the system needs from the end game report. I’ve attached a download link as well for coaches to use. Those nightly reports could also be used to send to all media outlets. They are easy to read and use as opposed to unformatted text in an email with players and stats that essentially have to be transposed line by line. The player and team names can be added ahead of time so all that is left to do after the game is to input the data. Just download the sheet and overwrite the data and team/player names.
(Download sheet)
End game stat sheet
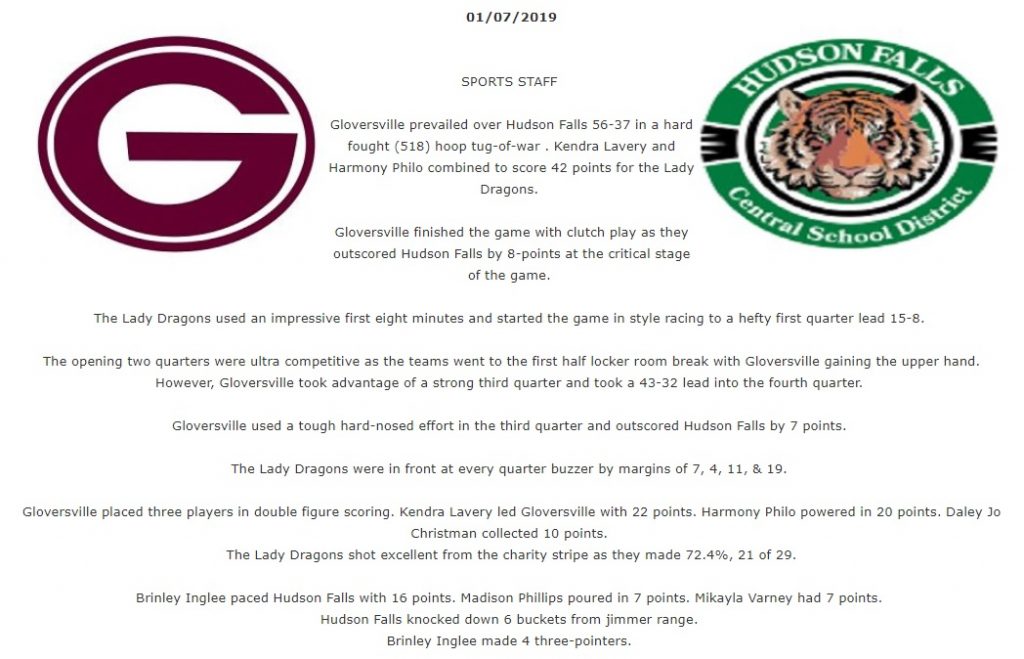
The game report from the download sheet above was used to generate this game recpap between Gloversville vs Hudson Falls.
Girls: Gloversville vs Hudson Falls
(What the game report sheet from coaches look like, below.)
| SCORE BY QUARTER | 1 | 2 | 3 | 4 | OT | FINAL |
| Gloversville | 15 | 12 | 16 | 13 | 0 | 56 |
| Hudson Falls | 8 | 15 | 9 | 5 | 0 | 37 |
| Name | 2PM | 3PM | FTM | FTA | PTS | |
| Daley Jo Christman | 4 | 0 | 2 | 2 | 10 | |
| Alecea Jones | 0 | 0 | 2 | 4 | 2 | |
| Madde Jones | 1 | 0 | 0 | 0 | 2 | |
| Harmony Philo | 3 | 1 | 11 | 11 | 20 | |
| Madelyn Avery | 0 | 0 | 0 | 4 | 0 | |
| Macey Salvione | 0 | 0 | 0 | 0 | 0 | |
| Taylor Mee | 0 | 0 | 0 | 0 | 0 | |
| Kiana Walters | 0 | 0 | 0 | 0 | 0 | |
| Kendra Lavery | 8 | 0 | 6 | 8 | 22 | |
| Katie Hastings | 0 | 0 | 0 | 0 | 0 | |
| Name | 2PM | 3PM | FTM | FTA | PTS | |
| Madison Phillips | 2 | 1 | 0 | 1 | 7 | |
| Laine Horrigan | 0 | 0 | 0 | 0 | 0 | |
| Kayleigh Osterhaudt | 1 | 0 | 0 | 0 | 2 | |
| Brinley Inglee | 1 | 4 | 2 | 2 | 16 | |
| Mikayla Varney | 1 | 1 | 2 | 4 | 7 | |
| Danielle Hogan | 0 | 0 | 0 | 0 | 0 | |
| Grace Davis | 1 | 0 | 0 | 0 | 2 | |
| Hailie Casey | 1 | 0 | 1 | 1 | 3 | |
| Emily Bedeaux | 0 | 0 | 0 | 0 | 0 | |
| END | END | END | END | END | END |
Each recap shows each team’s logo, sentences descriping how the game played out based on reported quarter scores, team and player stats, and a flow chart for each team at the bottom.
Take a look at some of the recaps on the main landing page to get an idea of how the reported stats are being formulated into the articles. If anyone wants to see what one of your games would look like send along a stat sheet from last year and I’ll add it to the site.
All recaps that are entered into the system, so far, are HERE:


